China Student Study with MindSpa
MindSpa China Study #2
- Measuring improvement in student test scores -
Zheng Yu Tong middle school, Shunde district, China
Conducted by: Dr. Ju-yuan Deng, Social Medicine Research Association (Guangdong), Psychological & Intelligence Development Research Center

Dr. Ju-yuan Deng
Social Medicine Research Association (Guangdong),
;Psychological & Intelligence Development Research Center
We conduct research studies in several parts of the world, in an effort to constantly improve our products and provide you with the most effective self-improvement tools possible.
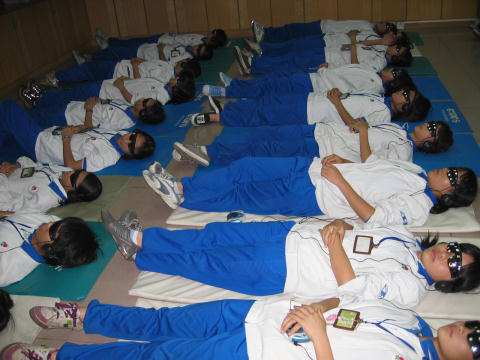
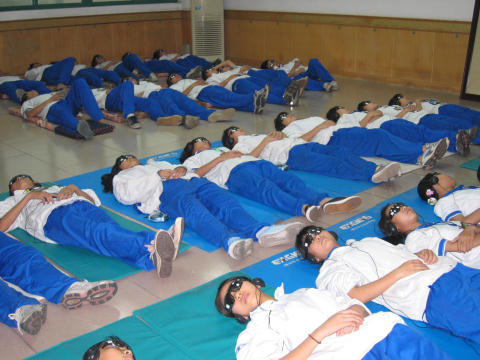
This study, the second in the series, involved over 40 middle school students in a six week trial using MindSpa MDS-12e sessions 11 and 12 on an alternate basis in the morning three times per week. The aim was to measure test score changes. Below is additional information.
MindSpa Audio Visual Stimulation Study
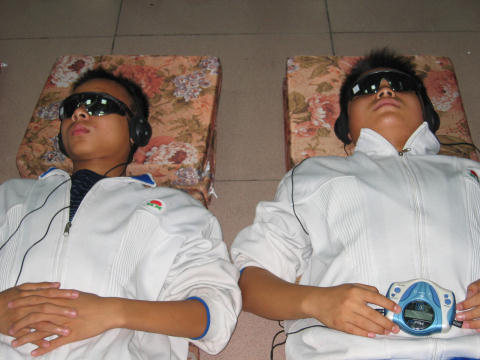
Experimental group: This group used AVS (Auditory-Visual Stimulation) 3 times a week for a total of 6 weeks. Program 11 and Program 12 alternating two days apart. The students are in a reclining position while undergoing AVS.
Control group: No AVS will be used.
Experimental purpose: The purpose of this experiment was to see if the Audio Visual Stimulation Technology is helpful to develop Chinese youth’s intelligence.
- Experimental material and methods
- General material:
- Experimental group
- Control group
1.2 Experimental methods:
The experimental group students will use AVS for six weeks, three times a week, each session will last 35 minutes. The two programs used will be alternated. Each student will use Program # 11 and Program # 12 each week for 6 weeks. Total of 18 AVT sessions. 9 sessions of Program #11, and 9 sessions of Program #12.
The control group will use no AVS
Evaluation methods:
- IQ test: Utilize the Raven’s Progressive Matrices to test both the control and experimental group students’ IQ before and after using AVS.
- Major courses scores comparisons: The SPSS statistical analysis software and t-test will be used to compare the difference between the former score and the latter score of each course for two groups.
- Self-evaluation: Has little significant scientific value, but can be used to describe the experimental group students’ experience of using AVS.
EExperimental Report of AVS
( AVS : Audio Visual Stimulation
Technology )

xperimental school: Zheng Yu Tong middle school, Shunde district
Experimental group: Class 5 of Junior Three, 50 students
Control group: Class 1 of Junior Three, 50 students
Experimental purpose: The purpose of this experiment is to see if the Audio Visual Entrainment Technology is helpful to develop Chinese youth’s intelligence.
Experimental material and methods
1.1 General material: Experimental group, Class 5, is a class in the lower level of study in Junior Three, including 14 male students and 36 female students, its average age is 15.
Control group, Class 1, is a class in the common level of study in Junior Three, including 21 male students and 29
female students, its average age is 15.

1.2 Experimental methods: The experimental group students used AVS for three month, sixth times a week, each time last 20 minutes (6:50 am~7:10 am). The control group didn’t use AVS.
Evaluation methods:
IQ test:
Utilized Raven’s Progressive Matrices to test the experimental group students’ IQ before and after using AVS, so did the control
group at the same time, comparing the difference between the former and latter IQ score for two groups.
Major courses scores comparisons:
Using the SPSS statistical analysis software, chose t-test to compare the difference between the former score and the latter score of each course for two groups.
Self-evaluation:
Self-evaluation is mainly according to the experimental group students’ experience of using AVS.
2. Experimental result
2.1 IQ score comparison
IQ score comparison of experimental group: 26 students’ IQ scores were improved, 14 students’ IQ scores were descended,10 students’ IQ scores had no change IQ score comparison of control group: 15 students’ IQ scores were improved, 30 students’ IQ scores were descended, 5 students’ IQ scores had no change
2.2 Major courses scores comparison
Experimental group students got much higher mean of score in all major courses after using AVS. The increased range was respectively Math: 22 points, Chinese: 30.48 points and English: 19 points.
As to the control group, the latter means of Math and English scores were better than their former ones. The increased range was respectively Math: 8.42 points and English: 2.6 points, however, Chinese score is contrary, the latter means of Chinese score was 4.64 points poorer than the former one.
3. Discussion (analysis)
3.1: Statistical analysis: Statistical analysis of IQ(Z– test)
N | Min. | Max. | Mean | Std. Deviation | |
Experimental group former IQ | 50 | 76 | 137 | 111.70 | 14.171 |
Experimental group latter IQ | 50 | 76 | 140 | 117.36 | 16.723 |
Control groupformer IQ | 50 | 79 | 140 | 116.06 | 16.930 |
Control grouplatter IQ | 50 | 83 | 140 | 114.32 | 16.152 |
Valid N (list wise) | 50 |
Since there are two means of IQ scores from two groups, and we want to see if their representative collectivities are
significant different, so we select Z –test method.
Relation between P and |Z|
|Z| | P | Significance |
|Z|≥2.58 |Z|≥1.96 |Z|<2.58 | P≤0.01 P≤0.05 P>0.05 | Extraordinary significant different Significant different Non-significant different |
Former Z value:

|Z|=1.397<1.96
The former IQ difference of the two groups is non-significant.
Latter Z value:

|Z|=0.925<1.96
The latter IQ difference of the two groups is also non-significant. The results indicated that at the 0.05 level of significance, AVS has not significant effect upon student’s IQ.
Statistical analysis of major Course scores(t – test)
t-test was used to perform the statistical analysis on the scores of major courses from two groups, via the SPSS statistical analysis software.
Relation between P and t
t | P | Significance of the Difference |
t ≥ t(df)0.01 t ≥ t(df)0.05 t < t(df)0.05 | P≤0.01 P≤0.05 P>0.05 | Extraordinary significant different Significant different Non-significant different |
A. Results analysis of comparing the former and latter scores of major courses (Paired samples t-test )
First, do a t-test for the former and latter major courses scores of each group, respectively. Judge the effectiveness of this experiment by the significance of the difference between the means of the former score and the latter score of each course.
a) t-test results of experimental group
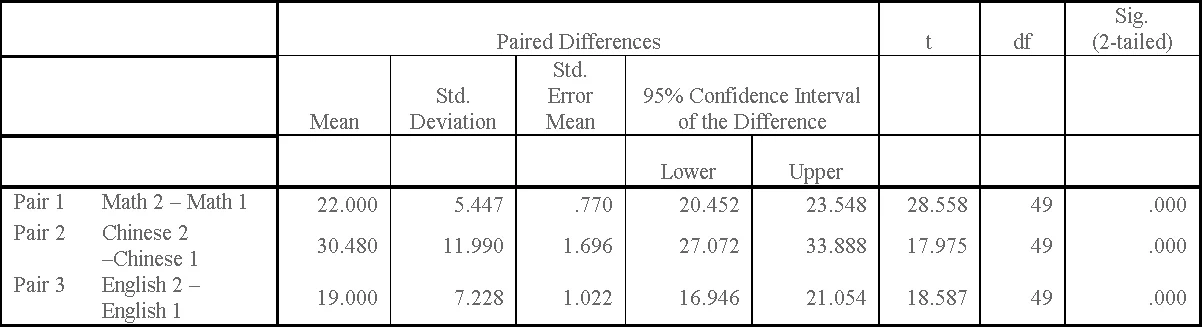
Table 1: Paired samples t-test results of experimental group(e2:e1)

Analysis of Statistical Results:
Table 1 illustrates that all the latter means of each major course score are higher than their former ones. The increased range was respectively Math: 22 points,
Chinese: 30.48 points and English: 19 points.
On the other hand, in table 1, all Significance Probability, P <0.01, that is to say, there is a extraordinary significant difference between the former and latter major courses scores, moreover, as mention above, all the latter means of major courses scores are better than the former ones, so we can make a conclusion that the experimental group gain obvious improvement in all major courses after using AVS.
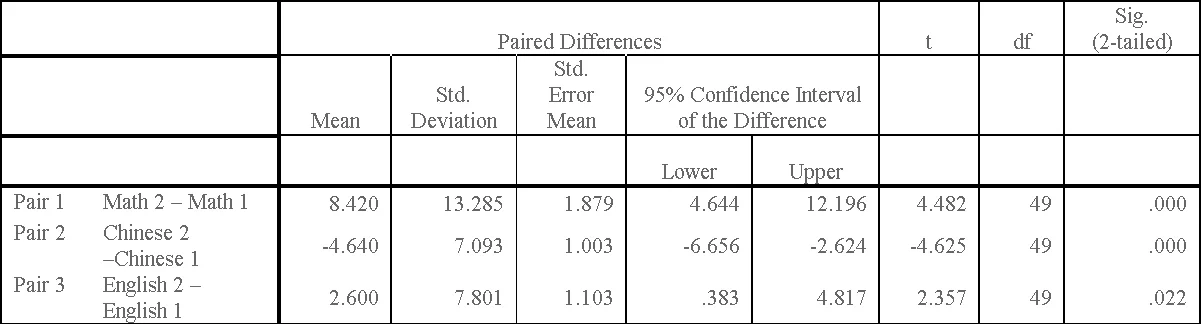
b) t-test results of control group:
Analysis of Statistical Results:
According to table 2, we can see that the control group students also got better
means of scores in Math and English than their former ones. The increased range was respectively Math: 8.42 points and
English: 2.6 points. However, Chinese score is contrary, the latter mean of Chinese score was 4.64 points poorer than the former one.
We can also see that all Significance Probability, P <0.05, that means there is significant difference between the means of the former scores and the latter scores for all major courses, combined with mention above, we can conclude that the control group students got some progress in Math and English study.
B. Results analysis of comparing the mean of the difference between the former and latter scores of two groups ( independent samples t-test )
As the results mentioned above, both experimental group and control group students performed better in Math and English study in this experiment, especial the experimental group. In terms of Chinese, the experimental group had a raise, while the
control group descends a little. In order to confirm the effectiveness of AVS for students’ study, we use independent samples t-test to compare the mean of the difference between the former and latter score of each course for two groups.
Table 3: Independent samples statistics of two groups
Group | N | Mean | Std. Deviation | Std. Error Mean | |
Math difference | Experimental group | 50 | 22.00 | 5.447 | .770 |
Control group | 50 | 8.42 | 13.285 | 1.879 | |
Chinese difference | Experimental group | 50 | 30.48 | 11.990 | 1.696 |
Control group | 50 | -4.64 | 7.093 | 1.003 | |
English difference | Experimental group | 50 | 19.00 | 7.228 | 1.022 |
Control group | 50 | 2.60 | 7.801 | 1.103 |
Table 4: Independent samples t-test results of two groups(e2-e1) : (c2-c1)
The results are summarized below:
From Table 3 and Table 4, we can see that all the means of the difference between the former and latter scores of the experimental group are better than those of the control group. The difference range is respectively Math: 13.58 points, Chinese:35.12 points and English:16.40 points
We can also see from table 4: About Math, the Sig. value of “Levene’s Test for Equality of Variances” is 0<0.05, that means “Equal variances not assumed”, so we should adopt the sig. value in the row of “Equal variances not assumed”, that is 0<0.05, in conjunction with analysis above (Math: 13.58 points), we can concluded that that the experimental group gain greater improvement in Math than the control group after they used AVS.
In terms of Chinese, the Sig. value of “Levene’s Test for Equality of Variances” is 0.002<0.05, so we should also adopt the sig. value in the row of “Equal variances not assumed”, that is 0<0.05, combined with analysis above (Chinese: 35.12), we can make a conclusion that the experimental group made more significant progress in Chinese than the control group after they used AVS.
As to English, the Sig. value of “Levene’s Test for Equality of Variances” is 0.530>0.05, therefore, we should adopt the sig. value in the row of “Equal variances assumed”, that is 0<0.05, combined with analysis above (English: 16.40 points), we can deduce that the experimental group had a better improvement in English than the control group after they used AVS.
To sum up the analysis above, we draw a conclusion that the experimental group had great progress in all major course study after they used AVS, that is to say, AVS can significantly promote the students’ study.
Statistical analysis of Questionnaire(Percentage test)
We adopted percentage test to do the statistical analysis of the student’s self-evaluation questionnaire.
Table Q1
Q1 | No effect | Fair effect | Good effect | Excellent effect |
How do you think of the effectiveness of AVS to your | 0 | 24 | 23 | 1 |
Percentage | 0% | 50% | 48% | 2% |
Table Q1 indicated that all students using AVS think it’s effective to their study, and half of students have a good evaluation on AVS.
Table Q2
Q2 | Attention concentration | Memory improvement | Emotion stabilization | Others |
What is the most significant effect of AVS to you? | 16 | 4 | 19 | 9 |
Percentage | 33.3% | 8.3% | 39.6% | 18.8% |
We can see from Table Q2, AVS has various effects upon student’s study. Particularly, “Attention concentration” and “Emotion stabilization”, both of them were chosen by over 1/3 students.
Table Q3
Q3 | Stop at once | Use occasionally | Keep on use |
Will you keep on use AVS? | 3 | 9 | 36 |
Percentage | 6.2% | 18.8% | 75% |
Table Q3 illustrates most of the experimental group students will continue to use AVS, 75% students will keep on use it.
Table Q 4
Q4 | Morning | Noon | Afternoon | Evening |
What is the best time for you to use AVS? | 29 | 5 | 3 | 11 |
Percentage | 60.4% | 10.4% | 6.2% | 23% |
Table Q 5
Q5 | Excellent | Fair | poor |
How do you think of | 48 | 0 | 0 |
Percentage | 100% | 0 | 0 |
It’s obvious in the results of Table Q5 that all experimental group students are satisfied with our work in this experiment.